NYC Property Tax

NYC commercial property tax rates compared to 9 other major cities
Published 7/16/2024 at 11:17 AM
By: Benjamin M. Williams
There are a few ways to compare property taxes between cities on an apples-to-apples basis.
- The effective tax rate is the tax divided by the market value.
- The other is property tax per square foot.
We review both metrics, and also the changes in value, rents, and cap rates for benchmark properties between these 10 major cities broken down by 4 sectors. The source of this data was the US Real Property Tax Benchmark Report 2024 prepared by Altus Group (the owner of ARGUS) on June 20, 2024.
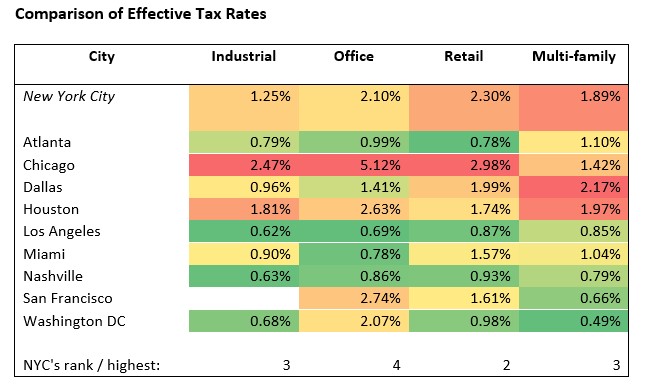
We can see that New York City ranks near the top in all categories with the highest effective tax rates.
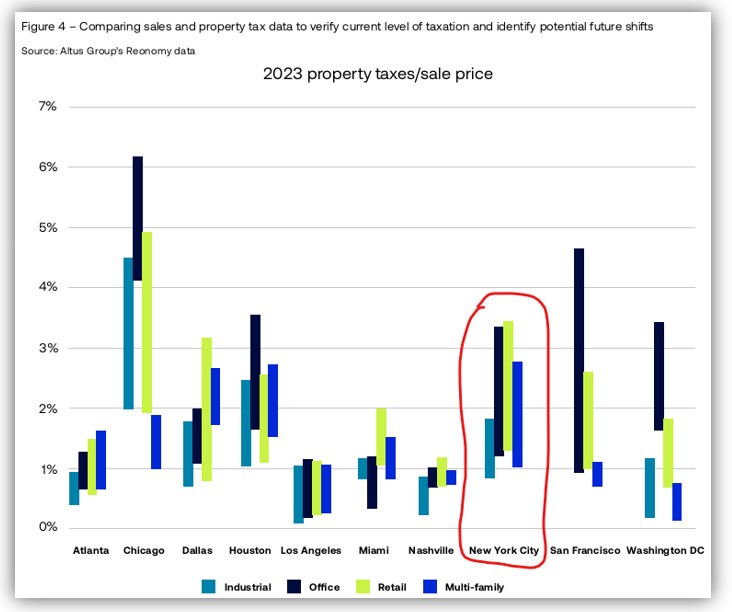
The above chart shows the interquartile range (25th-75th percentiles). The taller columns indicate a wider range of disparity, meaning within each sector, taxes are a less uniform relative to sales price. The industrial column is lower than office and retail, indicating some of these properties may have been relatively undervalued.
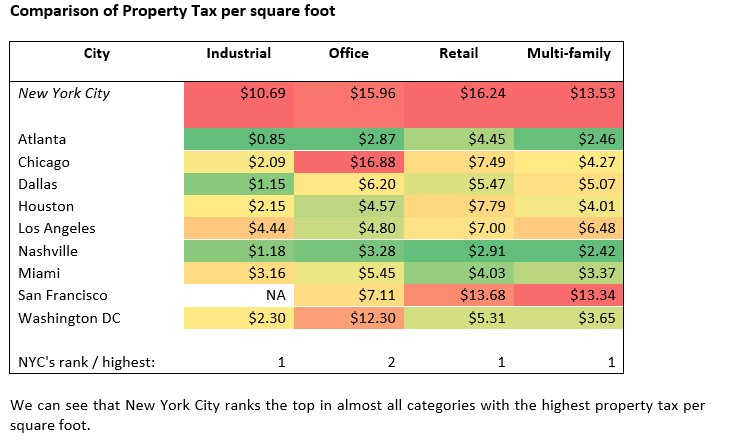
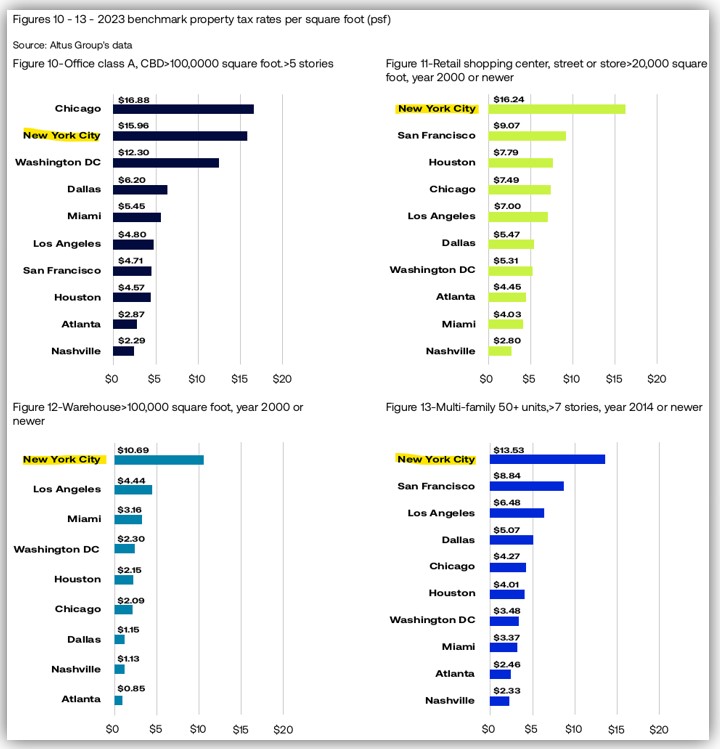
The above chart shows that New York City’s property tax per square foot for industrial properties is more than double the next highest city’s. Also, per the source, “Taxes for multi-family are highest in New York City and San Francisco – two cities facing significant housing affordability issues.”
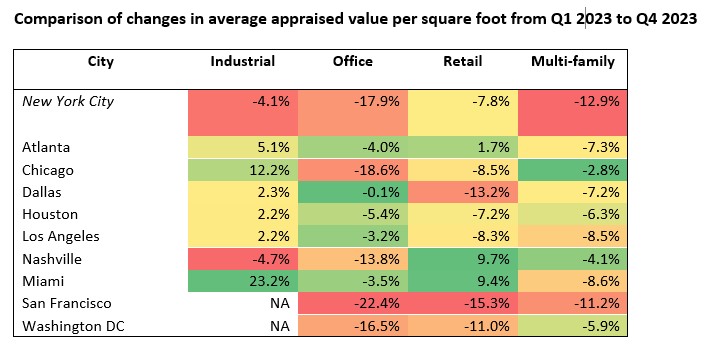
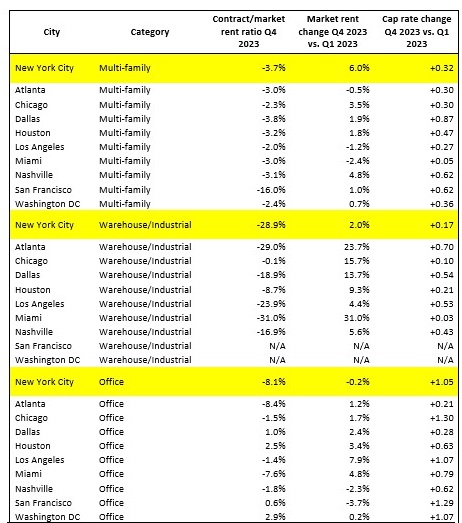
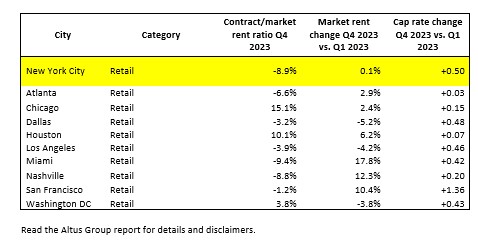
We can see that between the beginning and the end of 2023, New York City had the steepest drops in average appraised value per square foot for multi-family assets, and even bigger drops for office.
These value drops are largely due to lower rent growth, i.e. contract rents below market rents (negative ratios below), and increases in the average implied year 1-5 capitalization rate for all four sections in New York City: